ARTÍCULO
SPANISH EXIT POLLS. SAMPLING ERROR OR NONRESPONSE BIAS?
ENCUESTAS A PIE DE URNA EN ESPAÑA. ¿ERROR MUESTRAL O SESGO DE NO RESPUESTA?
Jose M. Pavía
University of Valencia
pavia@uv.es
Elena Badal
University of Valencia
Elena.Badal@uv.es
Belén García-Cárceles
University of Valencia
garcarbe@uv.es
ABSTRACT
Countless examples of misleading forecasts on behalf of both pre-election and exit polls can be found all over the world. Non-representative samples due to differential nonresponse have been claimed as being the main reason for inaccurate exit-poll projections. In real inference problems, it is seldom possible to compare estimates and true values. Electoral forecasts are an exception. Comparisons between estimates and final outcomes can be carried out once votes have been tallied. In this paper, we examine the raw data collected in seven exit polls conducted in Spain and test the likelihood that the data collected in each sampled voting location can be considered as a random sample of actual results. Knowing the answer to this is relevant for both electoral analysts and forecasters as, if the hypothesis is rejected, the shortcomings of the collected data would need amending. Analysts could improve the quality of their computations by implementing local correction strategies. We find strong evidence of nonsampling error in Spanish exit polls and evidence that the political context matters. Nonresponse bias is larger in polarized elections and in a climate of fear.
RESUMEN
Existe un gran número de ejemplos de predicciones inexactas obtenidas a partir tanto de encuestas pre-electorales como de encuestas a pie de urna a lo largo del mundo. La presencia de tasas de no-respuesta diferencial entre distintos tipos de electores ha sido la principal razón esgrimida para justificar las proyecciones erróneas en las encuestas a pie de urna. En problemas de inferencia rara vez es posible comparar estimaciones y valores reales. Las predicciones electorales son una excepción. La comparación entre estimaciones y resultados finales puede realizarse una vez los votos han sido contabilizados. En este trabajo, examinamos los datos brutos recogidos en siete encuestas a pie de urna realizadas en España y testamos la hipótesis de que los datos recolectados en cada punto de muestreo puedan ser considerados una muestra aleatoria de los resultados realmente registrados en el correspondiente colegio electoral. Conocer la respuesta a esta pregunta es relevante para analistas y encuestadores electorales, ya que, si se rechaza la hipótesis, las deficiencias de los datos recogidos deberían ser subsanadas en concordancia. Los analistas podrían mejorar la calidad de sus estimaciones mediante la implementación de estrategias de corrección local. En nuestro estudio encontramos una fuerte evidencia de errores ajenos al muestreo en las encuestas a pie de urna en España y constatamos la importancia del contexto político. El sesgo de no-respuesta es mayor en elecciones polarizadas y en un clima de violencia o presión.
Received: 18-11-2014; Accepted: 17-09-2015. Published on line: 23/08/2016
Cómo citar este artículo/Citation: Pavía , J.M., E. Badal and B. García-Cárceles. 2016. "Spanish exit polls. Sampling error or nonresponse bias?". Revista Internacional de Sociología 74(3):e043. doi: http://dx.doi.org/10.3989/ris.2016.74.3.043
KEYWORDS: Election night forecasts; measurement error; multi-hypergeometric distribution; nonresponse; Spanish regional elections.
PALABRAS CLAVE: Distribución multi-hipergeométrica; Elecciones regionales españolas; Error de medida; No-respuesta; Predicciones en la noche electoral.
Copyright: © 2016 CSIC. This is an open-access article distributed under the terms of the Creative Commons Attribution License (CC BY) Spain 3.0.
CONTENTS
INTRODUCTION Top
All around the world, statistical strategies have been systematically used for decades to anticipate election results on election nights. In order to inform a public eager for immediate data about the results of the polls in a timely manner, election prediction outcomes have been commissioned for all kinds of electoral races since the 1950s (Mitofsky 1991Mitofsky, W. 1991. "A short history of exit polls". Pp. 83-99 in Polling and Presidential Election Coverage, edited by P.J. Lavrakas and J.K. Holley. Newbury Park, CA: Sage.). Depending on the particular political context and the electoral rules operating in each election, specially-suited election night forecasting strategies have been assayed in different countries. There is also a large tradition of election night forecasting in Spain, with different methods having been tested from both the Bayesian (Bernardo 1984Bernardo, J.M. 1984. "Monitoring the 1982 Spanish socialist victory: A Bayesian analysis". Journal of the American Statistical Association 79:510-515. http://dx.doi.org/10.1080/01621459.1984.10478077., 1997Bernardo, J.M. 1997. "Probing public opinion: The state of Valencia experience". Pp. 3-21 in Bayesian Case Studies 3, edited by C. Gatsonis, J.S. Hodges, R.E. Kass, R. McCulloch, P. Rossi and N.D. Singpurwalla. New York: Springer-Verlag. http://dx.doi.org/10.1007/978-1-4612-2290-3_1.; Bernardo and Girón 1992Bernardo, J.M. and F.J. Girón. 1992. "Robust sequential prediction from non-random samples: The election night forecasting case". Pp. 61-77 in Bayesian Statistics 4, edited by J.M. Bernardo, J.O. Berger, A.P. Dawid and A.F.M. Smith. Oxford: Oxford University Press.) and the frequentist approaches (Pavía, Muñiz and Álvarez 2001Pavía, J.M., P. Muñiz and J.A. Álvarez. 2001. "Proyecciones en la noche electoral". Estadística Española 43:225-239.; Pavía-Miralles 2005Pavía-Miralles, J.M. 2005. "Forecasts from non-random samples: The election night case". Journal of the American Statistical Association 100:1113-1122. http://dx.doi.org/10.1198/016214504000001835.; Pavía, Larraz and Montero 2008Pavía, J.M., B. Larraz and J.M. Montero. 2008. "Election forecasts using spatiotemporal models". Journal of the American Statistical Association 103:1050-1059. http://dx.doi.org/10.1198/016214507000001427.; Pavía-Miralles and Larraz-Iribas 2008Pavía-Miralles, J.M. and B. Larraz-Iribas. 2008. "Quick-counts from non-selected polling stations". Journal of Applied Statistics 35:383-405. http://dx.doi.org/10.1080/02664760701834881.; Pavía 2010Pavía, J.M. 2010. "Improving predictive accuracy of exit polls". International Journal of Forecasting 26:68-81. http://dx.doi.org/10.1016/j.ijforecast.2009.05.001.; Sobrino 2012Sobrino, V.M. 2012. "Los avances de resultados en una jornada electoral". Más Poder Local 13:42-44.; Martín, Fernández and Modroño 2014Martín Arroyuelos, A.M., K. Férnandez Aguirre and J.A. Modroño Herrán. 2014. "Early forecasting of Parliamentary seats distribution: the representative polling stations method". Pp. 123-135 in New Perspectives on Stochastic Modeling and Data Analysis, edited by J. Bozeman, V. Girardin and C.H. Skiadas.).
Early returns, quick counts (from a meaningful sample of representative polling stations) and exit polls are ordinarily used by the analysts hired by political leaders and mass media to advance election night final results. Early return models and quick-count strategies rely on actual votes, whereas exit polls —and entrance polls (Klofstad and Bishin 2012Klofstad, C.A. and B.G. Bishin. 2012. "Exit and entrance polling: A comparison of election survey methods". Field Methods 24:429-437. http://dx.doi.org/10.1177/1525822X12449711.)— rest on declared votes. Exit-polling strategies, therefore, are subject, in part, to the miseries of surveys and can suffer some of the shortcomings of pre-election polls, although fortunately not all of them. Unlike a pre-election poll, which asks electors about their intentions several days before the election, an exit poll asks voters about an action they have just done. An exit poll is a survey of voters interviewed immediately after they have cast their ballots at their polling stations.
In an exit-poll dataset, therefore, rather than a guess of hypothetical actions, the collected data (should) constitute a record of facts just completed. Hence, compared to pre-election (and post-election) polls, exit polls are more reliable and their micro-data present some important characteristics that should help to improve the accuracy of forecasts. In particular, with exit-poll data (i) we do not need to identify which respondents will actually vote (Selb et al. 2013Selb, P., M. Herrmann, S. Munzert, T. Schübel and S. Shikano. 2013. "Forecasting runoff elections using candidate evaluations from first round exit polls". International Journal of Forecasting 29:541-547. http://dx.doi.org/10.1016/j.ijforecast.2013.02.001.); (ii) we do not need to ascertain how undecided voters will make their final decisions (Orriols and Martínez 2014Orriols, L. and A. Martínez. 2014. "The role of the political context in voting indecision". Electoral Studies 35:12-23. http://dx.doi.org/10.1016/j.electstud.2014.03.004.); (iii) we do not need to worry about voters who decide to change their mind in the last minute and, besides; (iv) we do not need to be so concerned about coverage issues (Haan, Ongena and Aarts 2014Haan, M., P.Y. Ongena and K. Aarts. 2014. "Reaching Hard-to-Survey Populations: Mode Choice and Mode Preference". Journal of Official Statistics 30:355-379. http://dx.doi.org/10.2478/jos-2014-0021.) or (v) about the fact that different people have different probabilities of being reached during the poll fieldwork (Díaz de Rada 2014Díaz de Rada, V. 2014. "Analysis of incidents in face-to-face surveys: Improvements in fieldwork". Revista Española de Investigaciones Sociológicas 145:43-72. http://dx.doi.org/10.5477/cis/reis.145.43.). Rather, an exit poll is specifically addressed to the voting population and, what is more, can collect very large samples in a very cost-effective manner. However, in the same way as other surveys, exit polls are still exposed to powerful potential sources of error, such as interviewer effects (Blom, de Leeuw and Hox 2011Blom, A.G., E.D. de Leeuw and J.J. Hox. 2011. "Interviewer effects on nonresponse in the European Social Survey". Journal of Official Statistics 27:359-377.), sampling design effects (Pavía and García-Cárceles 2012Pavía, J.M. and B. García-Cárceles. 2012. "Una aproximación empírica al error de diseño muestral en las encuestas electorales del CIS". Metodología de Encuestas 14:45-62.), noncoverage by early voting (Mokrzycki, Keeter and Kennedy 2009Mokrzycki, M., S. Keeter and C. Kennedy. 2009. "Cell-phone-only voters in the 2008 exit poll and implications for future noncoverage bias ". Public Opinion Quarterly 73:845-865. http://dx.doi.org/10.1093/poq/nfp081.), measurement errors (Pavía and Larraz 2012Pavía, J.M. and B. Larraz. 2012. "Nonresponse bias and superpopulation models in electoral polls". Revista Española de Investigaciones Sociológicas 137:237-264. http://dx.doi.org/10.5477/cis/reis.137.237.), or nonresponse (Groves et al. 2002Groves, R.M., D.A. Dillman, J.L. Eltinge and R.J.A. Little. 2002. Survey Nonresponse. New York: Wiley.), which can still seriously compromise their inferences.
Indeed, declining survey response rates are a growing concern worldwide (Keeter 2011Keeter, S. 2011. "Public opinion polling and its problems". Pp. 28-53 in Political Polling in the Digital Age: The Challenge of Measuring and Understanding Public Opinion, edited by K. Goidel. Baton Rouge: Louisiana State University Press.), which, according to Díaz de Rada (2013Díaz de Rada, V. 2013. "La no respuesta en encuestas presenciales realizadas en España". Revista Internacional de Sociología 71:357-381. http://dx.doi.org/10.3989/ris.2012.02.07.), is even threatening the future of surveys as a tool for gaining proper sociological knowledge, principally when nonresponse bias is present. Nonresponse bias (i.e., the existence of systematic differences between respondents and nonrespondents in the issues of interest) is nowadays considered the main source of error in both pre-election and exit polls (Beltrán and Valdivia 1999Beltrán, U. and M. Valdivia. 1999. "Accuracy and error in electoral forecasts: The case of Mexico". International Journal of Public Opinion Research 11:115-134. http://dx.doi.org/10.1093/ijpor/11.2.115.; Edison Media Research and Mitofsky International 2005Edison Media Research and Mitofsky International. 2005. Evaluation of Edison/Mitofsky election system 2004. http://abcnews.go.com/images/Politics/EvaluationofEdisonMitofskyElectionSystem.pdf Last access 07/02/2014.; Bautista et al. 2007Bautista, R., M. Callegaro, J.A. Vera and F. Abundis. 2007. "Studying nonresponse in Mexican exit polls". International Journal of Public Opinion Research 19:492-503. http://dx.doi.org/10.1093/ijpor/edm013.; Slater and Christensen 2008Slater, M. and H. Christensen. 2008. "Applying AAPOR’s final disposition codes and outcome rates to the 2000 Utah colleges’ exit poll". Pp. 37-50 in Elections and Exit Polling, edited by F.J. Scheuren and W. Alvey. Hoboken, NJ: Wiley.; Pavía 2010Pavía, J.M. 2010. "Improving predictive accuracy of exit polls". International Journal of Forecasting 26:68-81. http://dx.doi.org/10.1016/j.ijforecast.2009.05.001.; Pavía and Larraz 2012Pavía, J.M. and B. Larraz. 2012. "Nonresponse bias and superpopulation models in electoral polls". Revista Española de Investigaciones Sociológicas 137:237-264. http://dx.doi.org/10.5477/cis/reis.137.237.; Panagopoulus 2013Panagopoulus, C. 2013. "Who participates in exit polls?". Journal of Elections, Public Opinion and Parties 23:444-455. http://dx.doi.org/10.1080/17457289.2013.811585.) and can dramatically damage the quality of forecasts. In election polls, nonresponse bias arises due to differences in the likelihood of voters of various parties either providing an answer of their voting intentions or partaking in the survey. It may also be a result of interviewers’ differential propensities to select supporters of different parties (Pavía 2010Pavía, J.M. 2010. "Improving predictive accuracy of exit polls". International Journal of Forecasting 26:68-81. http://dx.doi.org/10.1016/j.ijforecast.2009.05.001.) due to a self-selection mechanism operating in interviewees in response to interviewers features (Haunberger 2010Haunberger, S. 2010. "The effects of interviewer, respondent and area characteristics on cooperation in panel surveys: a multilevel approach". Quality & Quantity 44:957-969. http://dx.doi.org/10.1007/s11135-009-9248-5.), or because some respondents hide their vote as a consequence of a social desirability bias (Krumpal 2013Krumpal, I. 2013. "Determinants of social desirability bias in sensitive surveys: a literature review". Quality & Quantity 47:2025-2047. http://dx.doi.org/10.1007/s11135-011-9640-9.). Furthermore, in exit polls, this could also happen because of different early voting rates among party supporters (Panagopoulus 2013Panagopoulus, C. 2013. "Who participates in exit polls?". Journal of Elections, Public Opinion and Parties 23:444-455. http://dx.doi.org/10.1080/17457289.2013.811585.).
There is a growing literature in the US evidencing differential nonresponse in US exit polls and proving that the differences between actual votes and exit-poll projections, measured as “within precinct error” (defined as the difference between the percentage margin between the leading candidates in the exit poll and the actual vote), are rising (Merkle and Edelman 2002Merkle, D.M. and M. Edelman. 2002. "Nonresponse in exit polls: a comprehensive analysis". Pp. 243-257 in Survey Nonresponse, edited by R.M. Groves, D.A. Dillman, J.L. Eltinge and R.J.A. Little. New York: Wiley.; Dopp 2006Dopp, K. 2006. "Vote Miscounts or Exit Poll Error? New Mathematical Function for Analyzing Exit Poll Discrepancy". . http://www.electionmathematics.org/em-exitpolls/Exit-Poll-Analysis.pdf Last access 07/02/2014.; Frankovic, Paganopoulus and Shapiro 2009Frankovic, K., C. Panagopoulos and R. Shapiro. 2009. "Opinion and election polls". Pp. 567-596 in Handbook of Statistics—Sample Surveys: Design Methods and Applications, Volume 29A, edited by D. Pfeffermann and C.R. Rao. Netherlands: Elsevier.). In this paper, we assess the nonresponse bias hypothesis in the context of Spanish exit polls. To do this, we analyze the relevant micro-data of seven exit polls conducted in Spain during the last ten years in five Spanish regions. In particular, we study both graphically and statistically (by hypothesis testing) whether the vote responses collected in each of the voting places can be thought of as a random sample of the actual vote distribution recorded in the polling location. Our hypothesis is that, in general, the samples cannot be observed as random samples and that, as we will argue, when the random sample null hypothesis is rejected the (alternative) most plausible (albeit not the only) explanation is nonresponse bias caused by differential nonresponse. Knowing the answer to this is relevant for both electoral analysts and forecasters as, if affirmative, the shortcomings of the collected data would need amending. Analysts could improve the quality of their computations by implementing local correction strategies. For example, given the strong linear relationship that links current and past biases at polling location level (see Figure 1), known past biases could be used to adjust local current estimates.
The rest of the paper is organized as follows. Section 2 revises, in the context of the total survey error paradigm, the potential sources of bias in Spanish exit polling and concludes nonresponse bias as being the main source of randomness deviations and the most plausible alternative hypothesis to the null hypothesis of sampling error. Section 3 is devoted to methodological issues. Section 4 presents the results of the analyses performed in the seven exit polls studied in this paper. Finally, section 5 discusses the findings. A statistical appendix with the tests implemented and some (online) supplementary material (http://www.uv.es/pavia/RIS/Supplemenraty_online_appendix.pdf) complete the paper.
SOURCES OF ERROR IN SPANISH EXIT POLLS Top
Although exit polls are also employed in many countries to understand why voters cast their ballots the way they do (Radcliff 2005Radcliff, B. 2005. "Exit polls". Polling America: An Encyclopedia of Public Opinion, Volume I (A-O), edited by S.J. Best and B. Radcliff. Westport, CT: Greenwood Press.), exit polls in Spain are very fast surveys exclusively designed to provide election forecasts. In a typical Spanish exit poll, poll respondents are asked mostly about (i) their current vote, (ii) their recall vote in the prior elections and (iii) about some of their demographic features (such as age, gender or educational level). Thus, when a Spanish voter is invited to take part in an exit poll, she knows with certainty that she is going to be asked (mainly) about her vote. As a consequence, item nonresponse is absent in Spanish exit polls and, a priori, only voters that are willing to inform about their vote accept pollsters’ requests to partake in the sample.
According to the total survey error paradigm, survey errors “may arise in the design, collection, processing, and analysis of survey data” (Biemer 2010Biemer, P.P. 2010. "Total Survey Error. Design, implementation and evaluation". Public Opinion Quarterly 74:817-848. http://dx.doi.org/10.1093/poq/nfq058.:817). In addition to sampling error, which is consubstantial to surveys, several other sources of error (coverage, nonresponse, adjustment, validity, measurement and processing) can cause differences between the data collected during the fieldwork and the actual outcomes. In the context of our research, an inadequate sampling design, noncoverage by early voting, processing errors, interviewer and respondent effects, and/or measurement error could potentially cause systematic deviations from the actual results.
Regarding sampling design, given that the goal of this research is to ascertain whether the vote responses collected in each single voting place can be observed as a random sample of the actual vote distribution recorded in that polling location, the only relevant issues are to know how voters are drawn in each polling place and whether the choosing mechanism could produce some systematic bias. Initially, no systematic error could be expected from the voters’ selection procedures, as systematic sampling is typically used in Spain to draw voters in each selected location (Sobrino 2012Sobrino, V.M. 2012. "Los avances de resultados en una jornada electoral". Más Poder Local 13:42-44.). Theoretically, the reached voters should be a random sample of the associated population. Nonetheless, if the field practice of systematic sampling is accompanied by some flaws in its implementation, such as the impossibility of reaching all the required voters in voting peaks, in the worst case in which peak-time voters are significantly different from valley-time voters the associated deviations could be attached to nonresponse bias due to noncoverage. Likewise, if, as seems to happen in the SigmaDos sampling selection mechanism, there is room for the existence of some kind of interviewer effect that might give rise to a differential probability of selecting supporters of different parties, this could also be observed as nonresponse bias.
Significant systematic deviances due to processing errors and early (mail) voting noncoverage are also unlikely in Spain. On the one hand, it is difficult to envisage a situation in which systematic and generalized processing errors occur. On the other hand, early voting is almost anecdotic in Spain. It represents less than 3% of votes, when for example early voting reached 32.7% in the 2008 US Presidential election (Mokrzycki, Keeter and Kennedy 2009Mokrzycki, M., S. Keeter and C. Kennedy. 2009. "Cell-phone-only voters in the 2008 exit poll and implications for future noncoverage bias ". Public Opinion Quarterly 73:845-865. http://dx.doi.org/10.1093/poq/nfp081.). Nevertheless, even in the event that the distributions of mailing and face voters were significantly different, the possible divergences triggered by this could again be contemplated as a part of nonresponse bias.
Measurement error and respondent effects would be the only remaining explanations to justify significant systematic differences between collected and recorded data. Measurement error happens when a reported value differs from the true value. It can have different causes; but given the simple questions asked in exit polls and the small temporal lag lapsed since the voting act, social desirability due to the sensitive nature of the topic seems the most likely reason. Although some isolated evidence of measurement error (which we might call “false reporting” in this context) can be found, there are several arguments against its massive presence in Spanish exit polls. On the one hand, as has been stated previously, when a voter is invited to take part in an exit poll, the fact that the interviewee already knows that he is going to be asked about his vote––added to the fact that exit polls are by far more anonymous compared to telephone surveys and face-to-face household interviews––means that, from a psychological point of view, interviewees feel freer and have few incentives to hide their actual vote (Turner et al. 1998Turner, C.F., L. Ku, S.M. Rogers, P.D. Lindberg, J.H. Pleck and F.L. Sonenstein. 1998. "Adolescent sexual behavior, drug use, and violence: Increased reporting with computer survey technology". Science 280:867-873. http://dx.doi.org/10.1126/science.280.5365.867.). On the other hand, from a statistical perspective, if massive measurement error were the norm, we would expect to observe a weak relationship between declared and recorded votes, an issue that is not supported by data (see Figures 1A-7A in the supplementary material: http://www.uv.es/pavia/RIS/Supplemenraty_online_appendix.pdf). What is more, if the hypothesis of nonresponse bias caused by nonrespondents’ features were the main cause of systematic deviations, following the argument stated in Pavía (2010Pavía, J.M. 2010. "Improving predictive accuracy of exit polls". International Journal of Forecasting 26:68-81. http://dx.doi.org/10.1016/j.ijforecast.2009.05.001.:70), we would expect to observe a strong relationship of the differences between real proportions and poll estimates in current and recall votes; an issue that indeed happens, as can be seen in Figure 1.
|
Figure 1. Comparison between the error (poll percentage of votes minus actual recorded percentage of votes) in estimating current and recall percentages of votes for the two main Spanish parties (PP, +; PS, ×) at polling location level in the three Corts Valencianes exit polls examined in this paper (2003, left panel; 2007, central panel; and, 2011, right panel)
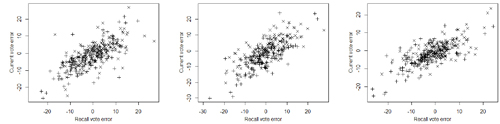
[Descargar tamaño completo]
| |
METHODOLOGICAL ISSUES Top
The geography of elections greatly varies from country to country and between elections in the same country. Nevertheless, whatever the country, electoral authorities distribute voters using a descending geographic-administrative hierarchical structure. The electorate is split into constituencies (the smallest units for which representative(s) are elected) and those again into several levels of smaller units (Pavía and López-Quilez 2013Pavía, J.M. and A. López-Quilez. 2013. "Spatial vote redistribution in redrawn polling units". Journal of the Royal Statistical Society A 176:655-678. http://dx.doi.org/10.1111/j.1467-985X.2012.01055.x).
In Spain, the smallest geographical units (called sections) are reached after dividing every municipality into small areas that vary in size, but comprise as a rule between 500 and 1,500 Spanish residents. Depending on physical and financial resources, the electorate of large sections can be additionally split into several subgroups according to their surnames. A different ballot box is used for each subgroup to cast their votes. They are not the only given administrative divisions of electors that practitioners can find though. As a consequence of logistic matters, electors of several voting boxes are grouped to share the same polling place on election day. Vicinity criteria are used to assign voting boxes to polling places with the constraint (except in exceptional circumstances) that all the voting boxes belong to the same section share-polling place.
Exit polls take advantage of the above structure to design their sampling plans. An exit poll is a cluster sample in which (usually) a hierarchical multistage stratified sampling design is employed to select the clusters (either sections or voting boxes) in the penultimate stage and then draw voters from the selected clusters using systematic sampling in the last stage (Sobrino 2012Sobrino, V.M. 2012. "Los avances de resultados en una jornada electoral". Más Poder Local 13:42-44.). In practice, however, interviews take place outside the polling building and the voters who are interviewed come from the several voting boxes placed at the chosen voting locations. Hence, the nonresponse bias hypothesis can be tested in each sample location since an exit poll can be thought of as an aggregation of independent samples collected in several polling places. Indeed, under the hypothesis of absence of nonresponse bias (and measurement error), the voters’ statements collected in each polling location can be observed as a simple random sample without replacement of the corresponding polling location vote population where each response belongs to one of the р competing political options (including electoral choices like blank and null votes). That is, if υki denotes the number of respondents that vote option k in polling location i, we have that the p x 1 vector υi = [υ1i, υ2i, . . . , υpi] would be an ideal text-book example of a multivariate hypergeometric distribution. In particular, υi ~ MHg(Ni, ni, Niπi), where Ni is the number of votes registered in polling location i, ni is the exit-poll sample size in polling location i, and πi is the p x 1 vector of proportions of votes gained by the p competing options in polling location i.
We take advantage of the above argument to test, in the seven exit polls analyzed in this paper, the hypotheses that the raw data collected in each sample location i have been generated by the corresponding multi-hypergeometric distribution. In particular, we implement four different goodness-of-fit tests to ascertain whether the hypotheses that vectors υi come from MHg(Ni, ni, Niπi) distributions can be accepted. Furthermore, given that if the null hypotheses were true, the estimates of the proportion of votes gained by each party in each polling location, p̂i = υi/ni, would be unbiased estimators of πi. We also state an additional test in which we examine whether the mean vector of the random vector p̂i equals πi. Details of these tests as well as of a simple test to detect measurement error are reported in the statistical appendix.
In addition, in the supplementary material, we present scatter plots of πi and the realizations of p̂i to provide a graphical illustration of the closeness of proportion estimates, p̂i, and true proportions, πi. The distance of each point from the 45º line will indicate how far apart the estimates and outcomes are. Likewise, since the clusters nominally selected correspond to either sections or voting boxes in Spanish exit polls (depending on the particular exit poll), in order to dispel any doubt about the actual practical implementation of the selection processes during the fieldwork, the aforementioned testing and graphical analyses have been also extended to compare the outcomes in nominal clusters to samples.
NONRESPONSE BIAS IN SPANISH EXIT POLLS Top
Spain’s geo-political organization divides the country into 17 regions, which have a substantial level of self-government. In each region, citizens elect their own regional parliament for a maximum four-year term. Each regional parliament has authority to shape its own electoral system, although the electoral rules are nevertheless quite similar among regions. Voters cast their ballots for closed list parties and thresholds are imposed, either at the regional or constituency level, to gain representation. In each region, the electoral space is divided into constituencies, where seats are allocated to parties according to the d’Hondt rule. The number of seats elected in each region and the rules used to apportion seats to constituencies vary greatly from region to region.
In this section, we study the presence of nonresponse bias in Spanish exit polling by examining the raw data of seven exit polls conducted in five different Spanish regions over a range of ten years by three different companies. We analyze the exit polls ordered by the Generalitat Valenciana (the regional government of Valencia) for the 2003, 2007 and 2011 Corts Valencianes elections and by FORTA (the Spanish Federation of Regional Organizations of Radio and Television) for the 2012 Parlamento de Andalucia election, the 2012 Parlament de Catalunya election, the 2012 Eusko Legebiltzarra election and the 2012 Parlamento de Galicia election. SigmaDos completed the 2003 and 2007 Corts Valencianes exit polls, a consortium consisting of GFK-Emer and ODEC were contracted to perform the fieldwork of the 2011 Corts Valencianes exit poll and the four 2012 exit polls ordered by FORTA were commissioned to Ipsos.
In addition to the results of analyzing (ordered chronologically) the likelihood that the data collected in each sample polling location can be considered as a random sample of actual results, in order to contextualize the results we also present in the supplementary material (i) aggregate numerical outlines of the outcomes of the exit polls judged against actual results and (ii) graphical summaries of the proportions collected and recorded in the sample locations. Given the large number of parties competing in each election, for operational reasons, we focus exclusively on those parties that reach parliament and group the remaining parties (including blank and, sometimes, null votes) in Others. To test measurement error, nevertheless, we recover the more detailed available data.
2003 Corts Valencianes Election
The Valencia region is one of seventeen autonomous regions in Spain. It is divided into three constituencies: Alicante, Castellon and Valencia. The Valencia parliament, or Corts Valencianes, consists of a single house (with 89 seats in 2003). Twenty seats are initially apportioned to each constituency and the remaining seats distributed among constituencies using population figures as weights. In the 2003 election, 30, 23 and 36 seats were allocated in Alicante, Castellon and Valencia, respectively. Among the fifteen parties presenting their candidature in the 2003 election, only three (the PP conservative party, the PS socialist party and the IU communist party) surpassed the 5% threshold of total regional vote imposed by the Valencian electoral law. Table I-A (in the supplementary material) shows the actual results recorded (in percentage of total votes) and the seats gained for these main parties.
SigmaDos was the company in charge of conducting the exit polls for the Generalitat Valenciana in this election. SigmaDos conducted an independent two-stage exit poll in each constituency. Firstly, with a probability of selection proportional to the number of voting boxes located in each polling place, SigmaDos randomly selected polling places (50 locations in Alicante, 30 in Castellon and 80 in Valencia) and, secondly, the largest possible number of voters was intercepted as they left their polling stations and interviewed face-to-face. The SigmaDos pollsters interviewed 21,204 voters. Records of refusals were not collected. Table I-A provides a summary of the raw data collected in each constituency and of the forecasts made by SigmaDos on election day.
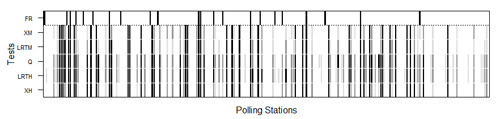
Looking at Figure 1A (see supplementary appendix), which provides a graphical comparison of actual and exit poll proportions at polling location (box) level, it seems that the aggregate biases were caused by systematic deviations between actual and collected proportions. A large fraction of the IU polling location (box) proportions is below the 45º line while the opposite occurs with the PP polling location (box) proportions. These systematic deviations are confirmed by hypothesis testing as shown in Figure 2, where a graphical summary of the decisions of the tests at the usual significant levels (0.1, 0.05 and 0.05) is displayed. The darker the figure, the greater the nonresponse bias.
At the usual (α =) 5% significance level, the hypotheses that the collected data represent random samples of actual outcomes are rejected for at least 43% of the samples. The multinomial approximations yield the more conservative outputs, while the most sensitive test is the one defined after the multi-Gaussian approximation, with the exact distribution tests being in an intermediate position. The test results are highly robust and consistent, showing an almost monotonic pattern. In particular, at the 5% significance level all the null hypotheses rejected by the more conservative test (the log-likelihood ratio test after multinomial approximation) are also rejected by the other tests.
|
Figure 2. Nonresponse hypothesis tests at polling place level for the 2003 Corts Valencianes election. The darker the figure, the greater the nonresponse bias. The black, dark grey and light grey shaded areas indicate rejection of the random sample null hypotheses at the 0.01, 0.05 and 0.1 significance levels, respectively. Polling places where false reporting (FR) was detected are flagged in black in the upper row. XH, LRTH, XM and LRTM denote Pearson’s χ2 and log-likelihood ratio tests under multi-hypergeometric distribution and after multinomial approximation, respectively, and Q multinormal test approximation.
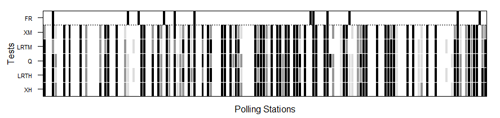
[Descargar tamaño completo]
| |
Measurement error was also present in this poll. In comparing collected responses to actual polling place outcomes, 12 (out of 160) samples were found for which more votes were collected than recorded in at least one political option. In general, nevertheless, it seems that false reporting was not a major concern as it occurred only to a small extent and for very minority options, with over-declared blank votes (“polite nonresponse”) being the most common erroneous response: five times. In one polling place (highlighted in Figure 1A), however, measurement error was a major issue. In a sample of 115 voters, sixteen respondents stated they had voted for UV (a right-wing regional party) when only four electors voted for UV in the corresponding polling place (1,122 voters).
2007 Corts Valencianes Election
On May 27, 2007, citizens from the Valencia region went to the polls to renew their parliament, which following a legislative modification had increased its number of seats from 89 to 99 (35 in Alicante, 24 in Castellon and 40 in Valencia). Divided into 6,239 voting boxes, the 3,435,072 registered voters had to choose from among seventeen parties. The parties gaining representation in the parliament were nevertheless (almost) the same as in 2003. In the election, IU ran in coalition with BN; a left-wing regional party that had attracted 4.7% of the total ballots in 2003. Table II-A summarizes the outcomes and the seats gained for these main parties.
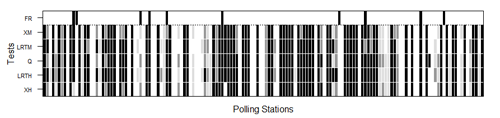
The Generalitat Valenciana again hired the services of SigmaDos to conduct the exit poll and the same sampling design as in 2003 was implemented. This time, out of a set of 2,214 polling places (Alicante 714, Castellon 343 and Valencia 1,157), SigmaDos randomly chose 49 locations in Alicante, 25 in Castellon and 77 in Valencia. From 9 am to 7 pm (an hour before the official time to vote ended), 21,517 interviews were completed. A summary of the raw data collected in each constituency and of the last wave of forecasts made by SigmaDos is displayed in Table II-A. Compared to 2003, the raw data on the exit poll show significantly more biases, although similar in fashion to the ones recorded for the previous poll. PP was again underrepresented and IU+BN overrepresented. On this occasion, moreover, at the expense of a higher (compared to 2003) underrepresentation of PP, PS was also eventually overrepresented.
|
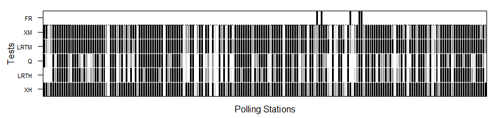
Figure 3. Nonresponse hypothesis tests at polling place level for the 2007 Corts Valencianes election. The darker the figure, the greater the nonresponse bias. The black, dark grey and light grey shaded areas indicate rejection of the random sample null hypotheses at the 0.01, 0.05 and 0.1 significance levels, respectively. Polling places where false reporting (FR) was detected are flagged in black in the upper row. XH, LRTH, XM and LRTM denote Pearson’s χ2 and log-likelihood ratio tests under multi-hypergeometric distribution and after multinomial approximation, respectively, and Q multinormal test approximation.
[Descargar tamaño completo]
| |
As hypothesis testing confirms (compare Figure 2 and Figure 3), the more biased aggregate results are a consequence of a larger number of biased samples. Note that the darker the figure, the more evidence of nonresponse bias. With α = 0.05, the percentage of samples for which the null hypothesis is rejected ranges from 57.6 to 62.3. The levels of concordance among tests are also impressive. Taking as a reference the most conservative test, all tests coincide in rejecting the null hypothesis of error sampling in the 96.6% of cases with α = 0.05, being the three cases with no coincidence due to only one test.
Measurement error was also an issue in this poll. In 10 (out of 151) samples, impossible responses were detected. In a great number of cases (70%), this was due to an excess of voters declaring blank votes. It seems that people who do not want to reveal their vote but do not refuse to collaborate tend to declare blank voting or, alternatively, a vote for a minority option. Indeed, the latter was the case in the polling place (highlighted in Figure 2A) where measurement error was very pronounced. Again in the constituency of Castellon we find a sample (corresponding to the unique polling place of a small village) where a large number of respondents false reported. Within a set of 111 answers, nine declarations to Others and eight to UV were collected when no votes for Others and only four votes for UV were actually recorded in the polling station.
2011 Corts Valencianes Election
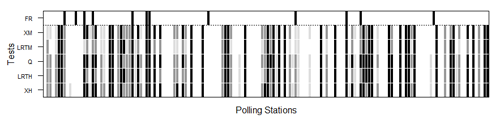
In 2011, the citizens of the Valencia region were called to elect the eighth regional parliament in their history. Twenty-six parties presented their candidatures. BN (now CC) and IU competed this time as independent formations and both surpassed the 5% threshold to gain representation. The results recorded and the seats gained for the four parties that reached the parliament are displayed in Table III-A. On this occasion, a temporary consortium of GFK-Emer and ODEC was commissioned by the Generalitat Valenciana to conduct the exit poll. Considering sections as nominal clusters, GFK-ODEC split the electoral space into four strata (Alicante, Castellon, the capital of the region and the rest of the province of Valencia) and, fixing the number of sections to be chosen in each stratum, selected a set of sections in each stratum with an aggregate behavior very similar to that of the corresponding stratum in the 2003 and 2007 elections. A total of 158 sampling locations (46 in Alicante, 32 in Castellon and 80 in Valencia) were selected and the voters drawn by systematic sampling. A total of 23,207 voters were interviewed and their vote declarations grouped into eight options: PP, PS, IU, CC, CVa, UPyD (a newly emerging national formation), Others and blank votes. A summary of the raw data collected and of the predictions made by GFK-ODEC on election day are shown in Table III-A.
|
Figure 4. Nonresponse hypothesis tests at polling place level for the 2011 Corts Valencianes election. The darker the figure, the greater the nonresponse bias. The black, dark grey and light grey shaded areas indicate rejection of the random sample null hypotheses at the 0.01, 0.05 and 0.1 significance levels, respectively. Polling places where false reporting (FR) was detected are flagged in black in the upper row. XH, LRTH, XM and LRTM denote Pearson’s χ2 and log-likelihood ratio tests under multi-hypergeometric distribution and after multinomial approximation, respectively, and Q multinormal test approximation.
[Descargar tamaño completo]
| |
In aggregate terms, raw data show important biases, presenting clearly similar patterns to the ones found in SigmaDos exit polls: an underrepresentation of PP and an overrepresentation of IU and CC (formerly BN). Indeed, the figures of nonresponse bias are quite similar to the ones detected in 2003, not only in aggregate terms. When comparing to polling location distributions (see Figure 4), the percentage of samples for which the null hypothesis is rejected at the 5% level is on average 42.8.
Regarding the measurement error, we found 12 polling places where more votes were collected than recorded in at least one political option. Of these, four cases were due to a surplus of blank votes, three to an excess of CC statements and five to more CVa respondents than voters. In none of these cases, however, was generalized false reporting discovered. In almost all the cases, the measurement error was due to one or two interviewees declaring a vote for an option that gained at most a vote in the corresponding polling place. The most striking difference is found in a sample (size 165) where seven voters declared a blank vote when in the population (765 voters) only three blank ballots existed.
2012 Parlamento de Andalucía Election
Andalusia is the largest region in Spain and has a parliament with 109 members. The region is divided into eight constituencies (provinces), each of which has initially apportioned eight seats, with the remaining 45 seats distributed in a fashion proportional to the total population of the provinces. In 2012, the number of seats allocated was 12 in Almeria, 15 in Cadiz, 12 in Cordoba, 13 in Granada, 11 in Huelva, 11 in Jaen, 17 in Malaga and 18 in Seville. Thirty-four parties presented candidatures in this election but only three of them (PP, PS and IU) obtained seats, despite some other parties (PA and UPyD) surpassing in some constituencies the threshold of 3% of valid votes that Andalusian electoral law imposes for entitlement to representation. Table IV-A summarizes the outcomes and the seats gained for the 2012 Andalusian parliamentary parties.
In order to provide data for informed on-air discussion during the period between the closing of polling stations and the declaration of the first results on TV broadcasts, FORTA commissioned the exit poll to Ipsos, who contrived a mixed sampling design––midway between the ones implemented by SigmaDos and GFK-ODEC––for choosing polling places. In particular, while taking a look at the results recorded in the previous election, Ipsos randomly picked voting boxes in each constituency considering the population sizes of the cities where the boxes were located. The selection was made in such a way that in provinces where the added outcomes of the (initially) chosen boxes were far from historical constituency results, new sets of boxes were repeatedly drawn until finding one set that was close enough. A total of 240 polling places were finally chosen (23 in Almeria, 34 in Cadiz, 27 in Cordoba, 29 in Granada, 22 in Huelva, 25 in Jaen, 36 in Malaga and 44 in Seville) and 36,621 citizens were interviewed face-to-face. A summary at provincial level of the raw data collected and of the predictions made by Ipsos is presented in Table IV-A.
In this instance, aggregate raw data were more accurate than forecasts. As a rule, PP was reasonably well-represented in the raw data, although PS was clearly underestimated in percentages. The corrections applied by Ipsos worsened both the proportion and the seat forecasts for all the parties. They introduced a positive bias to PP and a negative one to IU. According to Antonio Vera (former Ipsos Opinion director), this incorrect forecast performance was due to the hidden vote for PS; a phenomenon considered new in the Andalusian polling experience. In Vera’s own words:
I admit that we were disoriented by a peculiar phenomenon of these elections: the hidden vote for PS. In Andalusia, the hidden vote traditionally goes to PP, and we apply corrections to reduce the result we obtain for PS in order to compensate for it; it is systematic. But this time the opposite has happened (...) No matter how well you design the sample, you will not get the actual data, almost 40% of people do not answer the survey. We make estimates based on previous work, we have experience: we have been in this industry since 1982. (El País 2012El País. 2012. "¿Por qué fallaron las encuestas?". El País. 26 March. http://politica.elpais.com/politica/2012/03/26/actualidad/1332790007_767368.html Last access 06/03/2014.; authors’ translation from Spanish).
|
Figure 5. Nonresponse hypothesis tests at polling place level for the 2012 Parlamento de Andalucía election. The darker the figure, the greater the nonresponse bias. The black, dark grey and light grey shaded areas indicate rejection of the random sample null hypotheses at the 0.01, 0.05 and 0.1 significance levels, respectively. Polling places where false reporting (FR) was detected are flagged in black in the upper row. XH, LRTH, XM and LRTM denote Pearson’s χ2 and log-likelihood ratio tests under multi-hypergeometric distribution and after multinomial approximation, respectively, and Q multinormal test approximation.
[Descargar tamaño completo]
| |
The smaller bias presented in the raw data of this poll (compared to the Corts Valencianes exit polls) is reflected in Figure 5 and Figure 4A and results in a smaller percentage of samples for which nonresponse bias is detected. The percentages of rejected null hypothesis at the 0.05 significance level range from 22.5 to 36.7. It is worth noting here that when testing is done at the ballot box level, the smaller population sizes lead to a significant increase in rejections that now range from 38.3 to 70.4.
Measurement error is also present in this poll. We find evidence of false responses in as many as 22 polling locations (out of 240), with the over-reporting of blank votes again being the main reason. Indeed, this was the cause in 17 (out of 22) samples. In these samples, 3.75 voters declared on average a blank vote when the actual mean of blank votes in the corresponding polling stations was 1.76. In one of the samples, however, measurement error was generalized. In a very small village of the province of Granada with only 196 voters, Ipsos pollsters collected 21 declarations of votes for Others out of a sample of 56 when only one elector voted for Others in the village.
2012 Parlament de Catalunya Election
On November 25, 2012, the citizens of Catalonia went to the polls to elect their tenth parliament since democracy was restored in Spain. The Parlament de Catalunya consists of a single house composed of 135 members. Catalonia is divided into four constituencies (Barcelona, Girona, Lleida and Tarragona) with an initial allocation of six seats per constituency. An additional seat for each 40,000 inhabitants is allocated in Girona, Lleida and Tarragona, while Barcelona elects a seat for each 50,000 inhabitants, up to a maximum of eighty-five. In 2012, 85 seats were apportioned in Barcelona, 17 in Girona, 15 in Lleida and 18 in Tarragona among those parties obtaining at least 3% of valid votes in the province. Table V-A shows the results and the seats obtained for the seven parties that gained representation.
As happened in the four 2012 exit polls analyzed in this work, FORTA hired Ipsos’ services to support TV coverage and the same sampling design to the one implemented in Andalusia was employed. On this occasion, out of the 2,178 polling stations in which Catalonian electors were split, 200 polling places were chosen (101 in Barcelona, 33 in Girona, 32 in Lleida and 34 in Tarragona) and 31,242 voters were interviewed with their responses recorded in 13 alternatives: CiU (a right-wing regional party), PP, PS, IU, ERC (a left-wing regional party), C’s (a constitutionalist party), CUP (a left-wing regional party), PxC, SI, UPyD, Others, and blank and null votes. A summary of the raw data collected and of Ipsos’ predictions made public on election day by TV3 (the main Catalonian TV channel) for the parties gaining representation are shown in Table V-A.
Some patterns clearly emerge from Figure 5A. As a rule, CUP, ERC and, to a lesser extent, CiU (the group of Catalonian nationalist parties in favor of holding a self-determination referendum) tend to be overrepresented in the sample, whereas, on the other side, PP, C’s and PS (the group of constitutionalist parties that were against the referendum) tend to be underrepresented; a signal that their supporters declined, to a larger extent, to partake in the survey. These graphical impressions are corroborated when looking at the aggregate raw exit poll data (Table V-A) and the large number of samples for which the random hypothesis is rejected (see Figure 6).
|
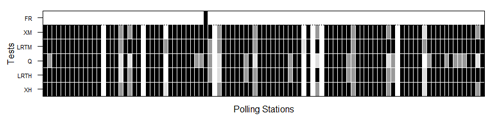
Figure 6. Nonresponse hypothesis tests at polling place level for the 2012 Parlament de Catalunya election. The darker the figure, the greater the nonresponse bias. The black, dark grey and light grey shaded areas indicate rejection of the random sample null hypotheses at the 0.01, 0.05 and 0.1 significance levels, respectively. Polling places where false reporting (FR) was detected are flagged in black in the upper row. XH, LRTH, XM and LRTM denote Pearson’s χ2 and log-likelihood ratio tests under multi-hypergeometric distribution and after multinomial approximation, respectively, and Q multinormal test approximation.
[Descargar tamaño completo]
| |
Certainly, as can be deduced from Figure 6, systematic nonresponse bias was the source of the extremely biased raw results recorded by Ipsos pollsters. The pro-Catalonian nationalist atmosphere that prevailed among public and published opinion during the campaign seems to have encouraged constitutionalist supporters to hide their opinions and provoked a spiral of silence (Noelle-Neumann 1984Noelle-Neumann, E. 1984. The Spiral of Silence: Public Opinion – Our Social Skin. Chicago: The University of Chicago Press.). Indeed, the percentages of polling places in which the simple random sample hypothesis is rejected at the usual 0.05 significance level ranges from a minimum of 82 to a maximum of 95.5; a clear indicator of the great extent of nonresponse bias in this survey. Measurement error however was not a major issue in this poll. Erroneous responses were detected in only five (out of 200) samples and they were very isolated events, such as an interviewee declaring a null vote in a polling station where no null votes were recorded or a voter proclaiming to have voted for UPyD in a station with no UPyD ballots tallied.
2012 Eusko Legebiltzarra Election
The Basque country is, together with Catalonia and Galicia, one of the so-called Spanish historical regions. The Basque Parliament, or Eusko Legebiltzarra, consists of a single house composed of 75 members. Each one of the Basque Country’s three provinces (Alava, Biscay and Gipuzkoa) is a constituency that elects 25 representatives. The Basque electoral system favors the sparsely populated province of Alava at the expense of the most populated Biscay. In each constituency, seats are apportioned among parties receiving at least 3% of all valid votes cast in the constituency, including blank ballots.
In 2012, Basque electors went to the polls to renew their parliament. This was the first election since democracy was restored in Spain without the omnipresent threat of ETA violence. The ETA terrorist group had pledged not to kill again, despite having not yet disbanded. Five parties gained representation in this election: PNV (a moderate right-wing nationalist party), EH (a broad coalition of separatist parties and members of the former Batasuna, ETA’s outlawed political wing), PS, PP and UPyD. Table VI-A displays the outcomes and the seats gained for the main lists.
Exit polling was again carried out by Ipsos, which on this occasion interviewed 8,987 voters in 100 randomly selected voting places (22 in Alava, 45 in Biscay and 33 in Gipuzcoa). It is worth noting the relatively low number of voters interviewed in this survey. On average, only 89.9 voters per polling place responded to Ipsos pollsters’ call, when this figure reached 140.6, 144.3, 156.2 and 142.1 in the Valencian, Andalusian, Catalonian and Galician polls, respectively. Without doubt, the history of violence experienced for decades by non-nationalist supporters (PS, PP, UPyD and others) made these voters more reluctant to manifest their political opinion to strangers. This is clearly reflected in the raw data of the poll (whose aggregate values by province along with the Ipsos forecasts broadcasted by the EiTB public media group are available in Table VI-A) and in the large number of samples for which nonresponse bias is evident (see Figure 7).
|
Figure 7. Nonresponse hypothesis tests at polling place level for the 2012 Eusko Legebiltzarra election. The darker the figure, the greater the nonresponse bias. The black, dark grey and light grey shaded areas indicate rejection of the random sample null hypotheses at the 0.01, 0.05 and 0.1 significance levels, respectively. Polling places where false reporting (FR) was detected are flagged in black in the upper row. XH, LRTH, XM and LRTM denote Pearson’s χ2 and log-likelihood ratio tests under multi-hypergeometric distribution and after multinomial approximation, respectively, and Q multinormal test approximation.
[Descargar tamaño completo]
| |
Nonresponse bias is more evident in Gipuzkoa, where the radical nationalists have historically registered larger support. The percentage of polling places where the simple random sample hypothesis is rejected at 5% significant level is nevertheless quite similar in all the three provinces: around 90 per cent. Finally, conversely to nonresponse bias, which was generalized, measurement error was almost absent. Indeed, impossible responses were detected in a single sample and were due to the over-reporting of blank votes.
2012 Parlamento de Galicia Election
Galicia is divided into four constituencies (provinces). The Parlamento de Galicia consists of a unicameral legislature formed by 75 seats, which are apportioned in each constituency among lists collecting at least 5% of all valid votes cast in the constituency. Each province attracts an initial minimum of ten seats, the remaining 35 seats being allocated among provinces in a fashion proportional to their populations. In 2012, La Corunna, Lugo, Orense and Pontevedra were apportioned 24, 15, 14 and 22 seats, respectively. In this election, only four (out of 26) lists reached parliament: PP, PS, BNG (a left-wing nationalist party) and AGE (a coalition of IU and a scission of BNG headed by its former leader). Table VII-A shows the outcomes achieved for the main lists. Ipsos conducted the exit poll for CRTVG (the FORTA Galician associate) in 144 polling stations (49 in La Corunna, 27 in Lugo, 26 in Orense and 42 in Pontevedra) with a total of 22,467 voters. In aggregate terms, the raw data were within acceptable limits, although with a clear underestimation of PP votes.
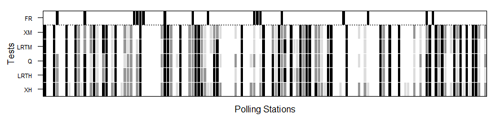
In analyzing the data at polling location level, we observe (Figure 8) that, on average, the hypothesis of random sampling is rejected in 43.6% of stations at the 0.05 significance level. Nonresponse bias was therefore also an issue in this survey, favoring as a rule nationalist lists (mainly AGE) in detriment of national parties (PP and PS) (see Figure 7A). Nonresponse, however, does not reach the high levels recorded in Catalonia and the Basque Country. The relatively smaller presence of nationalists in Galicia and the more relaxed political climate of this election resulted in nonresponse figures in line with those recorded in Andalusia and mainly the Valencian region.
|
Figure 8. Nonresponse hypothesis tests at polling place level for the 2012 Parlamento de Galicia election. The darker the figure, the greater the nonresponse bias. The black, dark grey and light grey shaded areas indicate rejection of the random sample null hypotheses at the 0.01, 0.05 and 0.1 significance levels, respectively. Polling places where false reporting (FR) was detected are flagged in black in the upper row. XH, LRTH, XM and LRTM denote Pearson’s χ2 and log-likelihood ratio tests under multi-hypergeometric distribution and after multinomial approximation, respectively, and Q multinormal test approximation.
[Descargar tamaño completo]
| |
In addition to nonresponse bias, measurement error was also present in this poll. Evidence of error responses was found in as many as 17 polling locations, although as usual this was due to slight over-reporting of small political options. Indeed, the measurement error was due to an excess of only one vote in 12 out of the 17 samples and the sources of false reporting were placed in the five small options also recorded in the sample: blank votes and SCD (six times each), CxG and UPyD (three times each) and null votes (one time).
CONCLUSIONS Top
An exit poll is an in-person survey of voters interviewed about their electoral choices just after they have cast their ballots. Exit polls are mainly used to forecast final election outcomes, which are presented to the public once balloting has concluded. Indeed, these forecasts are frequently used on special TV programs, which achieve audiences that are among the highest reached by current affairs broadcasts, as a basis for informed on-air discussion during the period elapsed between the closing of polling stations and the releasing of initial outcomes.
In many countries, exit polls are also used to recognize which issues were in the minds of the voters when deciding their vote and to identify how different groups in the electorate cast their ballots (Radcliff 2005Radcliff, B. 2005. "Exit polls". Polling America: An Encyclopedia of Public Opinion, Volume I (A-O), edited by S.J. Best and B. Radcliff. Westport, CT: Greenwood Press.). Further, in the weeks and months following the election, they are reassessed by political analysts to give meaning to the election outcomes and scrutinized by partisan pundits to discern successful and failed campaign strategies. Moreover, according to Best and Krueger (2012Best, S.M. and B.S. Krueger. 2012. Exit Polling: Surveying the American Electorate, 1972–2010. Los Angeles: CQ Press, Sage. http://dx.doi.org/10.4135/9781452234410.:1), in the United States they are the talk of the nation on election day and are used by newly elected officials “to substantiate policy mandates they claim to have received from voters”.
The validity of all the above tasks and analyses, however, rely to a great extent on the quality of the data. In the same way that nonresponse bias can damage the accuracy of forecasts and hinder our efforts to improve them, this can harm the soundness of other analyses for which we have no external reference. Hence, knowing the presence and extension of nonresponse bias is essential in order to implement proper strategies that reduce its consequences.
There is already extensive literature on the presence and impact of nonresponse bias in exit polls in US elections and some other isolated studies made in other countries. This research explores the issue for the case of Spain using seven exit polls, an unusually large number of instances (all the authors were able to obtain) that make our conclusions highly robust. In particular, we find strong evidence of nonresponse bias in Spanish exit polling that, being generalized, seems to be larger in those elections in which there is a great polarization of the electorate (as in the 2012 Catalonian election; polarized around the self-determination referendum issue) and/or with a strongly oppressive atmosphere (as in the 2012 Basque Country elections; historically threatened by ETA terrorism). We also detect a certain presence of measurement error in the samples; which fortunately was very isolated and seems to be canalized mainly to blank voting. Indeed, it appears that people that do not want to reveal their vote but neither refuse to collaborate with pollsters tend to declare blank voting or, as an alternative, a vote for a minority option.
According to our analyses, the data seem to point towards the validity of our initial hypothesis: that nonresponse bias is mostly caused by the existence of a correlation between the vote and the willingness to collaborate. For instance, the largest levels of bias were observed in the 2012 Catalonian and Basque elections, where the oppressive (pro-referendum and ETA threat) atmospheres could propitiate a context in which the willingness to collaborate of constitutionalist supporters was largely discouraged. In this line, we can recall the significantly lower number of voters that were interviewed, on average, per polling place in the Basque survey.
We must acknowledge, however, that with our data it is impossible to disentangle respondent effects from interviewer effects, when it is well known that interviewer characteristics can also affect the probability of eliciting participation in an interview. An ingenious experimental design is required to try to offer direct evidence about the determinants of the systematic deviations.
ACKNOWLEDGEMENTSTop
The authors wish to thank three anonymous referees and the RIS editorial committee for their valuable comments and recommendations; the Generalitat Valenciana, especially Eugenia Domenech, for their inestimable help in providing the raw data of the 2003, 2007 and 2011 Corts Valencianes exit polls; the general secretary of FORTA, Enrique Laucirica, and the staff at Ipsos for providing the answers to the question ‘Could you please tell me which party you have just voted for?’ corresponding to the four 2012 exit polls examined in this paper; as well as the staff at the INE for providing the postal addresses of the polling stations. We would also like to thank the director of SigmaDos, Jose M. de Elies, and Antonio Vera, the former director of Spanish Ipsos Opinion, for kindly answering the authors’ queries about the exit poll sampling designs, and Marie Hodkinson for revising the English of the paper. Support from the Spanish Ministry of Economics and Competitiveness through project CSO2013-43054-R is also acknowledged.
REFERENCESTop
|
| ○ | Bautista, R., M. Callegaro, J.A. Vera and F. Abundis. 2007. "Studying nonresponse in Mexican exit polls". International Journal of Public Opinion Research 19:492-503. http://dx.doi.org/10.1093/ijpor/edm013. |
| ○ | Beltrán, U. and M. Valdivia. 1999. "Accuracy and error in electoral forecasts: The case of Mexico". International Journal of Public Opinion Research 11:115-134. http://dx.doi.org/10.1093/ijpor/11.2.115. |
| ○ | Bernardo, J.M. 1984. "Monitoring the 1982 Spanish socialist victory: A Bayesian analysis". Journal of the American Statistical Association 79:510-515. http://dx.doi.org/10.1080/01621459.1984.10478077. |
| ○ | Bernardo, J.M. 1997. "Probing public opinion: The state of Valencia experience". Pp. 3-21 in Bayesian Case Studies 3, edited by C. Gatsonis, J.S. Hodges, R.E. Kass, R. McCulloch, P. Rossi and N.D. Singpurwalla. New York: Springer-Verlag. http://dx.doi.org/10.1007/978-1-4612-2290-3_1. |
| ○ | Bernardo, J.M. and F.J. Girón. 1992. "Robust sequential prediction from non-random samples: The election night forecasting case". Pp. 61-77 in Bayesian Statistics 4, edited by J.M. Bernardo, J.O. Berger, A.P. Dawid and A.F.M. Smith. Oxford: Oxford University Press. |
| ○ | Best, S.M. and B.S. Krueger. 2012. Exit Polling: Surveying the American Electorate, 1972–2010. Los Angeles: CQ Press, Sage. http://dx.doi.org/10.4135/9781452234410. |
| ○ | Biemer, P.P. 2010. "Total Survey Error. Design, implementation and evaluation". Public Opinion Quarterly 74:817-848. http://dx.doi.org/10.1093/poq/nfq058. |
| ○ | Blom, A.G., E.D. de Leeuw and J.J. Hox. 2011. "Interviewer effects on nonresponse in the European Social Survey". Journal of Official Statistics 27:359-377. |
| ○ | Cresie, N. and T.R.C. Read. 1984. "Multinomial goodness-of-fit tests". Journal of the Royal Statistical Society B 46:440-464. |
| ○ | Childs, A. and N. Balakrishnan. 2000. "Some approximations to the multivariate hypergeometric distribution with applications to hypothesis testing". Computational Statistics and Data Analysis 35:137-154. http://dx.doi.org/10.1016/S0167-9473(00)00007-4. |
| ○ | Cleophas, T.J. and A.H. Zwinderman. 2011. "Log likelihood ratio tests". Pp. 37-38 in Statistical Analysis of Clinical Data on a Pocket Calculator. Springer. http://dx.doi.org/10.1007/978-94-007-1211-9_13. |
| ○ | Díaz de Rada, V. 2013. "La no respuesta en encuestas presenciales realizadas en España". Revista Internacional de Sociología 71:357-381. http://dx.doi.org/10.3989/ris.2012.02.07. |
| ○ | Díaz de Rada, V. 2014. "Analysis of incidents in face-to-face surveys: Improvements in fieldwork". Revista Española de Investigaciones Sociológicas 145:43-72. http://dx.doi.org/10.5477/cis/reis.145.43. |
| ○ | Dopp, K. 2006. "Vote Miscounts or Exit Poll Error? New Mathematical Function for Analyzing Exit Poll Discrepancy". http://www.electionmathematics.org/em-exitpolls/Exit-Poll-Analysis.pdf Last access 07/02/2014. |
| ○ | Edison Media Research and Mitofsky International. 2005. Evaluation of Edison/Mitofsky election system 2004. http://abcnews.go.com/images/Politics/EvaluationofEdisonMitofskyElectionSystem.pdf Last access 07/02/2014. |
| ○ | El País. 2012. "¿Por qué fallaron las encuestas?". El País. 26 March. http://politica.elpais.com/politica/2012/03/26/actualidad/1332790007_767368.html Last access 06/03/2014. |
| ○ | Frankovic, K., C. Panagopoulos and R. Shapiro. 2009. "Opinion and election polls". Pp. 567-596 in Handbook of Statistics—Sample Surveys: Design Methods and Applications, Volume 29A, edited by D. Pfeffermann and C.R. Rao. Netherlands: Elsevier. http://dx.doi.org/10.1016/S0169-7161(08)00022-9 |
| ○ | Groves, R.M., D.A. Dillman, J.L. Eltinge and R.J.A. Little. 2002. Survey Nonresponse. New York: Wiley. |
| ○ | Haan, M., P.Y. Ongena and K. Aarts. 2014. "Reaching Hard-to-Survey Populations: Mode Choice and Mode Preference". Journal of Official Statistics 30:355-379. http://dx.doi.org/10.2478/jos-2014-0021. |
| ○ | Haunberger, S. 2010. "The effects of interviewer, respondent and area characteristics on cooperation in panel surveys: a multilevel approach". Quality & Quantity 44:957-969. http://dx.doi.org/10.1007/s11135-009-9248-5. |
| ○ | Keeter, S. 2011. "Public opinion polling and its problems". Pp. 28-53 in Political Polling in the Digital Age: The Challenge of Measuring and Understanding Public Opinion, edited by K. Goidel. Baton Rouge: Louisiana State University Press. |
| ○ | Klofstad, C.A. and B.G. Bishin. 2012. "Exit and entrance polling: A comparison of election survey methods". Field Methods 24:429-437. http://dx.doi.org/10.1177/1525822X12449711. |
| ○ | Krumpal, I. 2013. "Determinants of social desirability bias in sensitive surveys: a literature review". Quality & Quantity 47:2025-2047. http://dx.doi.org/10.1007/s11135-011-9640-9. |
| ○ | Martín Arroyuelos, A.M., K. Férnandez Aguirre and J.A. Modroño Herrán. 2014. "Early forecasting of Parliamentary seats distribution: the representative polling stations method". Pp. 123-135 in New Perspectives on Stochastic Modeling and Data Analysis, edited by J. Bozeman, V. Girardin and C.H. Skiadas. |
| ○ | Menold, N. and C.J. Kemper. 2014. "How do real and falsified data differ? Psychology of survey response as a source of falsification indicators in face-to-face surveys". International Journal of Public Opinion Research 26:41-65. http://dx.doi.org/10.1093/ijpor/edt017. |
| ○ | Merkle, D.M. and M. Edelman. 2002. "Nonresponse in exit polls: a comprehensive analysis". Pp. 243-257 in Survey Nonresponse, edited by R.M. Groves, D.A. Dillman, J.L. Eltinge and R.J.A. Little. New York: Wiley. |
| ○ | Mitofsky, W. 1991. "A short history of exit polls". Pp. 83-99 in Polling and Presidential Election Coverage, edited by P.J. Lavrakas and J.K. Holley. Newbury Park, CA: Sage. |
| ○ | Mokrzycki, M., S. Keeter and C. Kennedy. 2009. "Cell-phone-only voters in the 2008 exit poll and implications for future noncoverage bias ". Public Opinion Quarterly 73:845-865. http://dx.doi.org/10.1093/poq/nfp081. |
| ○ | Noelle-Neumann, E. 1984. The Spiral of Silence: Public Opinion – Our Social Skin. Chicago: The University of Chicago Press. |
| ○ | Orriols, L. and A. Martínez. 2014. "The role of the political context in voting indecision". Electoral Studies 35:12-23. http://dx.doi.org/10.1016/j.electstud.2014.03.004. |
| ○ | Panagopoulus, C. 2013. "Who participates in exit polls?". Journal of Elections, Public Opinion and Parties 23:444-455. http://dx.doi.org/10.1080/17457289.2013.811585. |
| ○ | Pavía, J.M. 2010. "Improving predictive accuracy of exit polls". International Journal of Forecasting 26:68-81. http://dx.doi.org/10.1016/j.ijforecast.2009.05.001. |
| ○ | Pavía, J.M. and B. García-Cárceles. 2012. "Una aproximación empírica al error de diseño muestral en las encuestas electorales del CIS". Metodología de Encuestas 14:45-62. |
| ○ | Pavía, J.M. and B. Larraz. 2012. "Nonresponse bias and superpopulation models in electoral polls". Revista Española de Investigaciones Sociológicas 137:237-264. http://dx.doi.org/10.5477/cis/reis.137.237. |
| ○ | Pavía, J.M., B. Larraz and J.M. Montero. 2008. "Election forecasts using spatiotemporal models". Journal of the American Statistical Association 103:1050-1059. http://dx.doi.org/10.1198/016214507000001427. |
| ○ | Pavía, J.M., P. Muñiz and J.A. Álvarez. 2001. "Proyecciones en la noche electoral". Estadística Española 43:225-239. |
| ○ | Pavía, J.M. and A. López-Quilez. 2013. "Spatial vote redistribution in redrawn polling units". Journal of the Royal Statistical Society A 176:655-678. http://dx.doi.org/10.1111/j.1467-985X.2012.01055.x. |
| ○ | Pavía-Miralles, J.M. 2005. "Forecasts from non-random samples: The election night case". Journal of the American Statistical Association 100:1113-1122. http://dx.doi.org/10.1198/016214504000001835. |
| ○ | Pavía-Miralles, J.M. and B. Larraz-Iribas. 2008. "Quick-counts from non-selected polling stations". Journal of Applied Statistics 35:383-405. http://dx.doi.org/10.1080/02664760701834881. |
| ○ | Radcliff, B. 2005. "Exit polls". Polling America: An Encyclopedia of Public Opinion, Volume I (A-O), edited by S.J. Best and B. Radcliff. Westport, CT: Greenwood Press. |
| ○ | Rechner, A.C. 2002. Methods of Multivariate Analysis. New York: John Wiley & Sons. |
| ○ | Selb, P., M. Herrmann, S. Munzert, T. Schübel and S. Shikano. 2013. "Forecasting runoff elections using candidate evaluations from first round exit polls". International Journal of Forecasting 29:541-547. http://dx.doi.org/10.1016/j.ijforecast.2013.02.001. |
| ○ | Slater, M. and H. Christensen. 2008. "Applying AAPOR’s final disposition codes and outcome rates to the 2000 Utah colleges’ exit poll". Pp. 37-50 in Elections and Exit Polling, edited by F.J. Scheuren and W. Alvey. Hoboken, NJ: Wiley. |
| ○ | Sobrino, V.M. 2012. "Los avances de resultados en una jornada electoral". Más Poder Local 13:42-44. |
| ○ | Tourangeau, R., L.J. Rips and K. Rasinki. 2000. The Psychology of Survey Response. Cambridge, UK: Cambridge University Press. http://dx.doi.org/10.1017/CBO9780511819322. |
| ○ | Turner, C.F., L. Ku, S.M. Rogers, P.D. Lindberg, J.H. Pleck and F.L. Sonenstein. 1998. "Adolescent sexual behavior, drug use, and violence: Increased reporting with computer survey technology". Science 280:867-873. http://dx.doi.org/10.1126/science.280.5365.867. |
|
STATISTICAL APPENDIXTop
This appendix shows the details of the hypothesis tests performed. Without loss of generality, polling place sub-indexes have been omitted to simplify the exposition. Firstly, we present the tests implemented after approaching the multi-hypergeometric distribution by a multinomial distribution. Secondly, the multivariate mean test is presented after approaching the multi-hypergeometric distribution by a multivariate normal. Thirdly, the tests performed based on the actual multi-hypergeometric distribution are described. Finally, a simple test to detect measurement error is stated.
Multinomial Approach
As is well known, when the sample fraction is n/N, small sampling without replacement is not too much different than sampling with replacement and the multivariate hypergeometric distribution can be well approximated by the simpler multinomial distribution, MN(n, π), for which popular goodness-of-fit tests exist. We have carried out the two most popular instances of the power divergence statistic (Cresie and Read 1984Cresie, N. and T.R.C. Read. 1984. "Multinomial goodness-of-fit tests". Journal of the Royal Statistical Society B 46:440-464.): the tests based on the Pearson’s χ2 statistic, equation (1), and on the log-likelihood ratio statistic, LRT, equation (2).
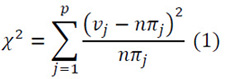
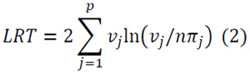
These discrepancy measures follow asymptotically (when n → ∞) a chi-squared distribution on p - 1 degrees of freedom under the null hypothesis, so that rejection occurs when the observed value of the corresponding statistic exceeds a pre-specified quantile of the chi-squared distribution. Although both tests are similar, the sensitivity of the χ2 test is limited and not entirely accurate if some of the expected values under H0 are smaller than 5. The LRT test is therefore an adequate alternative with generally better sensitivity (Cresie and Read 1984Cresie, N. and T.R.C. Read. 1984. "Multinomial goodness-of-fit tests". Journal of the Royal Statistical Society B 46:440-464.).
Multivariate Normal Approach
The above approximation of the multi-hypergeometric distribution by a multinomial distribution makes testing simple but has two drawbacks. First, the multinomial approximation distorts the correlation structure among the components of the random vector. Certainly, although MN(n, π) and MHg(N, n, Nπ) distributions share the mean vector, their covariance matrices are different. Second, the approximation rests on the hypothesis of a small sample fraction; an issue that is not always present in exit polling. Hence, as an alternative to the above approximation, the Dirichlet and the multi-Gaussian approximations could be used for the relative sample frequencies. As an advantage, these approaches maintain the correlation structure of the variables. We focus exclusively on the multi-Gaussian approach.
Following Childs and Balakrishnan (2000Childs, A. and N. Balakrishnan. 2000. "Some approximations to the multivariate hypergeometric distribution with applications to hypothesis testing". Computational Statistics and Data Analysis 35:137-154. http://dx.doi.org/10.1016/S0167-9473(00)00007-4.) and Pavía and Larraz (2008Pavía, J.M., B. Larraz and J.M. Montero. 2008. "Election forecasts using spatiotemporal models". Journal of the American Statistical Association 103:1050-1059. http://dx.doi.org/10.1198/016214507000001427.), it could be shown that the vector of relative frequencies, p̂, of the multivariate hypergeometric random variables could be approximated (when n → ∞) to a multivariate normal distribution with mean π and variances and covariances defined by equations (3) and (4):
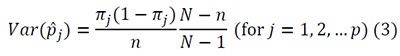
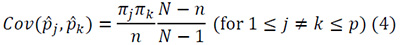
After this approximation, the multivariate normal testing theory can be used to perform a test about the mean. Denoting by Σ the p x p singular covariance matrix with diagonal elements given by (3) and off-diagonal entries given by (4) and by Σ-1 the Moore-Penrose generalized inverse of Σ, we can complete the mean test for the case of a multivariate normal with known covariance matrix using the statistic Q given by equation (5) (see, for example, Rechner 2002Rechner, A.C. 2002. Methods of Multivariate Analysis. New York: John Wiley & Sons., Ch. 5).

This Q statistic follows a chi-squared distribution on p – 1 degrees of freedom under the null hypothesis.
Multivariate Hypergeometric Tests
The above tests offer interesting approximations to analyze the goodness-of-fit of collected data to actual outcomes. The computation power available nowadays, however, enables reaching more exact solutions, making it possible to find solutions to this problem without needing to appeal to asymptotic approximations. Hence, as an alternative to the previous tests, we have programmed a bunch of R functions (multihyper.r) that provides support to perform the log-likelihood ratio test (Cleophas and Zwinderman 2011Cleophas, T.J. and A.H. Zwinderman. 2011. "Log likelihood ratio tests". Pp. 37-38 in Statistical Analysis of Clinical Data on a Pocket Calculator. Springer. http://dx.doi.org/10.1007/978-94-007-1211-9_13.) defined by (6)—which was computed using the actual probabilities of the multi-hypergeometric distribution and, as is well known, asymptotically follows a chi-squared distribution on p – 1 degrees of freedom under the null hypothesis—and a test based on the χ2 statistic, equation (1), where the p-value is obtained comparing to the empirical distribution of the χ2 statistic approximated by Monte Carlo simulation under MHg(N, n, Nπ).
Detecting Measurement error
Detecting response errors made by individual respondents is a very difficult task that requires a true reference value. Hence, except in exceptional cases where the responses can be compared to independent data, at most what we can achieve is a suspicion of some error or inconsistency. In exit polling, this task is even more complex as the small number of questions answered by each interviewee makes it impossible (in practice) to implement an imputation procedure as an auditing tool and to derive falsification indicators (Menold and Kemper 2014Menold, N. and C.J. Kemper. 2014. "How do real and falsified data differ? Psychology of survey response as a source of falsification indicators in face-to-face surveys". International Journal of Public Opinion Research 26:41-65. http://dx.doi.org/10.1093/ijpor/edt017.). Even though it is unfeasible to rule out individual response errors in exit polling, in aggregate terms response errors certainly might be detected in some way. Since we have true reference values (the actual outcomes recorded in each polling location), we can compare the collected data and the true values and flag as samples with measurement error those samples for which more responses were collected than actual votes recorded in at least one political option. In particular, those samples for which the inequality min(Nπ - v) < 0 applies.
|
JOSE M. PAVÍA holds a MSc in Maths and PhD in Economics and Business Science. He is a Professor of Quantitative Methods at the Universitat de Valencia (Spain) and director of the Elections and Public Opinion Research Group of the Universitat de Valencia. His areas of interest include election forecasting, nonresponse bias, multiple imputation, spatial statistics, demographic issues, regional economics and income inequality. |
ELENA BADAL VALERO earned a MSc in Actuarial and Financial Sciences in 2012 at the Universitat de Valencia, where she was awarded the prize for outstanding academic performance, and a BSc in Business Sciences in 2010 at the Universitat de Valencia. She is currently a PhD candidate at the Universitat de Valencia where she is conducting research on multiple imputation and gender effects on item nonresponse as a member of the Elections and Public Opinion Research Group of the Universitat de Valencia. |
BELÉN GARCÍA-CÁRCELES has a BSc in Economics and MSc in Biostatistics from the University of Valencia and has been a member of the Elections and Public Opinion Research Group of the University of Valencia since 2012. She has received a fellowship from the “Atracció Talent” program of the Vice-Rectorate for Research at the University of Valencia. |
|
|